SQL 2016 Query Store
SQL Server 2016 Query Store Introduction
Among all of the new SQL Server 2016 Database Engine features Query Store stands out as a great addition to the performance tuning tools currently available out of the box.The Query Store feature helps you to track query plans, runtime statistics and queries/plans history. It also helps you find regressing queries. You can quickly find new queries with multiple plans, identify un-efficient plans and force a better plan.
Among all of the new SQL Server 2016 Database Engine features Query Store stands out as a great addition to the performance tuning tools currently available out of the box.The Query Store feature helps you to track query plans, runtime statistics and queries/plans history. It also helps you find regressing queries. You can quickly find new queries with multiple plans, identify un-efficient plans and force a better plan.
Enable SQL Server 2016 Query Store
Query Store could be enabled and configured using the new "Query Store" database property page:
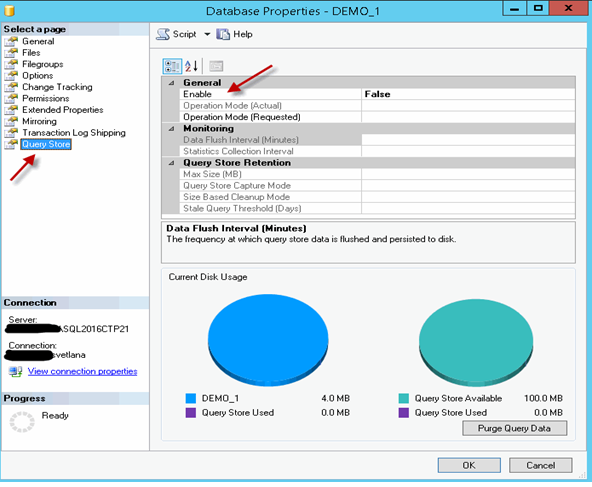
It could also be enabled using T-SQL:
ALTER DATABASE [DEMO_1] |
SQL 2016 Query Store Configuration
Once you enabled the Query Store for the database you can configure other Query Store settings (configurable settings are in bold font and highlighted):
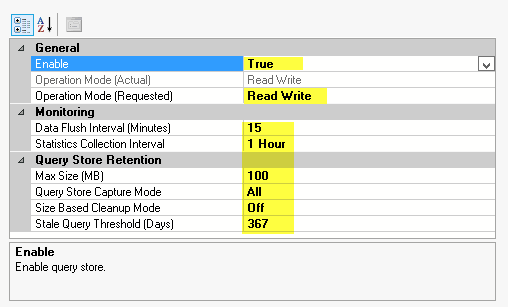
Click on each property to see it's description. You can find more details about each configuration option here.The Query Store configuration can also be changed using T-SQL:
| ALTER DATABASE [DEMO_1] SET query_store (operation_mode = read_only, cleanup_policy = ( stale_query_threshold_days = 367), data_flush_interval_seconds = 900, interval_length_minutes = 60, max_storage_size_mb = 100, query_capture_mode = auto, size_based_cleanup_mode = auto) go |
Let's review other information that is available on the "Query Store" property page.
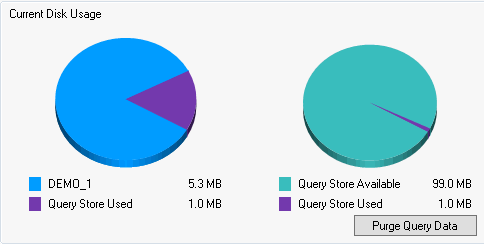
Current Disk Usage
This section displays the Database Size and the Query Store usage on the left and the Query Store Size and usage on the right:
Note the "Purge Query Data" button on the "Query Store" page. You can remove the contents of the Query Store using this button or use one of these statements below:
ALTER DATABASE [DEMO_1] |
| EXEC sys.Sp_query_store_flush_db |
SQL Server Query Store System Objects and New Extended Events
There are 6 new system stored procedures and 7 catalog views related to the Query Store in SQL Server 2016 CTP 2.2 which can be found by running this query:
| SELECT NAME, type_desc FROM sys.all_objects WHERE NAME LIKE '%query_store%' OR NAME = 'query_context_settings' |
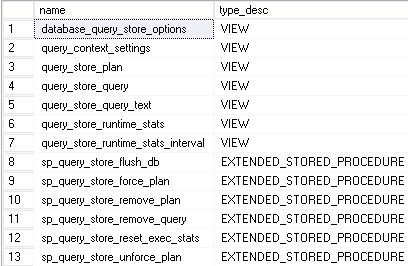
Also, there are 19 new extended events:
- query_store_background_task_persist_started - Fired if the background task for Query Store data persistence started execution
- query_store_background_task_persist_finished - Fired if the background task for Query Store data persistence is completed successfully
- query_store_load_started - Fired when query store load is started
- query_store_db_data_structs_not_released - Fired if Query Store data structures are not released when feature is turned OFF.
- query_store_db_diagnostics - Periodically fired with Query Store diagnostics on database level.
- query_store_db_settings_changed - Fired when Query Store settings are changed.
- query_store_db_whitelisting_changed - Fired when Query Store database whitelisting state is changed.
- query_store_global_mem_obj_size_kb - Periodically fired with Query Store global memory object size.
- query_store_size_retention_cleanup_started - Fired when size retention policy clean-up task is started.
- query_store_size_retention_cleanup_finished - Fired when size retention policy clean-up task is finished.
- query_store_size_retention_cleanup_skipped - Fired when starting of size retention policy clean-up task is skipped because its minimum repeating period did not pass yet.
- query_store_size_retention_query_deleted - Fired when size based retention policy deletes a query from Query Store.
- query_store_size_retention_plan_cost - Fired when eviction cost is calculated for the plan.
- query_store_size_retention_query_cost - Fired when query eviction cost is calculated for the query.
- query_store_generate_showplan_failure - Fired when Query Store failed to store a query plan because the showplan generation failed.
- query_store_capture_policy_evaluate - Fired when the capture policy is evaluated for a query.
- query_store_capture_policy_start_capture - Fired when an UNDECIDED query is transitioning to CAPTURED.
- query_store_capture_policy_abort_capture - Fired when an UNDECIDED query failed to transition to CAPTURED.
- query_store_schema_consistency_check_failure - Fired when the Query Store schema consistency check failed.
SQL Server Management Studio (SSMS) Query Store Features
SQL Server Management Studio (SSMS) Query Store Features
After enabling Query Store the database will have the new "Query Store" container in SSMS:
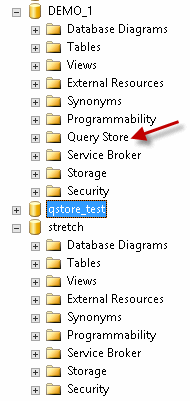
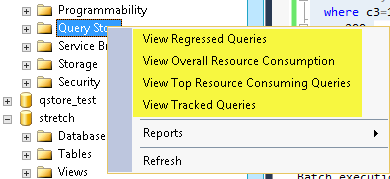
You can right click the "Query Store" container to view available options:

Most of the Query Store panes have similar structure and display options. Let's review them on the "Top Resource Consumers" pane example:
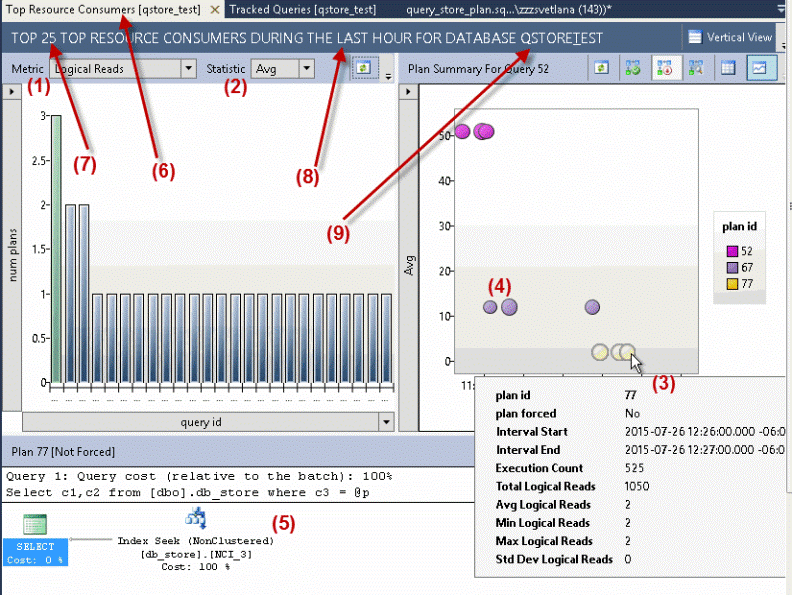
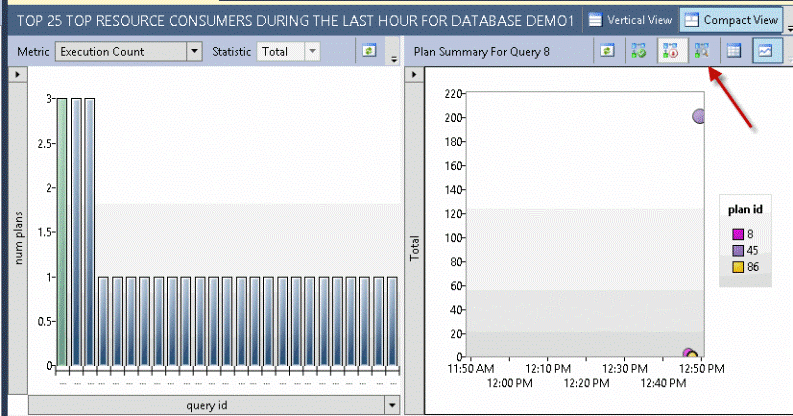
The right chart of the pane (called "Plan Summary") displays statistics of the selected/highlighted query (green bar on the left chart) based on the selected "Metric" (1) and "Statistic" (2). Selected "Statistic" becomes a vertical axis for the right chart.
Refresh button on the left chart will refresh both charts. The same button on the right chart will only refresh the right chart.
Note that we have selected query with multiple plans for review ("num plans" vertical axis on the left chart). The right chart displays each plan in different color.
You can mouse over (3) on a left or right chart's object and see the detailed statistics for specific query_id or plan_id.The details will be different depending on the metric selected:
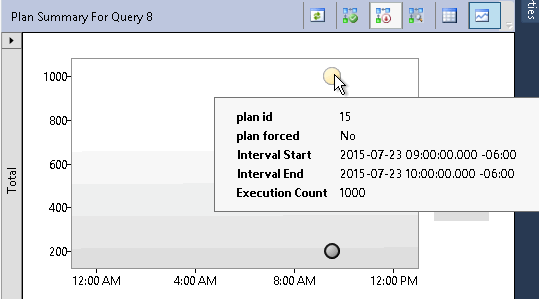
When you click on different plans ((3) or (4)) the bottom part of the pane (5) will display the execution plan for this particular plan_id.
Note some of the titles that are dynamic. The pane's name (6) will be "Top Resource Consumers [db_name]". The header in our example is: "Top 25 Top Resource Consumers During the last hour for database qstore_test". Where these parts of the title are dynamic:
- (7) - "Top 25" - configurable value (we will review configuration options below)
- (8) - "last hour" - configurable value
- (9) - "qstore_test" - monitored database name
Let's review the dropdown menus in the "Top Resource Consumers" pane:
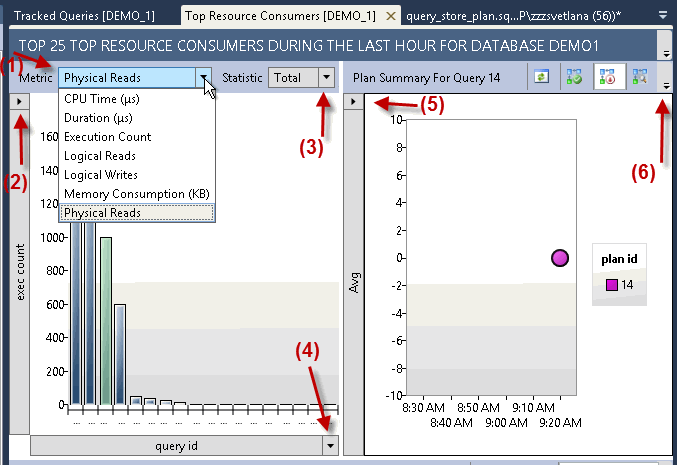
(1) Metrics available:
- CPU Time
- Duration (Default)
- Execution Count
- Logical Reads
- Logical Writes
- Memory Consumption
- Physical Reads
(2) Left Chart - Vertical Axis:
- "exec count" - executions count
- "num plans" - number of plans
- the third, default option is dynamic and it is based on the metric (1) and statistic (3) selected. The display format is "[statistic] [metric]". For example: "avg logical reads".Note, that when "Execution count" metric is selected then only 2 options are available: "exec count" and "num plans".
(3) Statistics:
- Avg (Default)
- Max
- Min
- Std Dev
- Total
(4) Left Chart - Horizontal Axis:
- "query id" (Default)
- "exec count"
- the third option is dynamic and it is based on the metric (1) and statistic (3) selected. The display format is "[statistic] [metric]". For example: "total logical reads". Note, that when "Execution count" metric is selected then only 2 options are available: "exec count" and "num plans".
(5) Right Chart ("Plan Summary") Vertical Axis changes based on the "Statistics" selected on the left chart:
- Avg (Default)
- Max
- Min
- Std Dev
Note, that if "Total" statistics selected on the left chart the right chart's axis is set to "Avg". This might change in the final release.
(6) If you have smaller screen resolution some buttons will be hidden.
Let's click "Grid" on the right chart and "Vertical View" next to the title and review the buttons available:
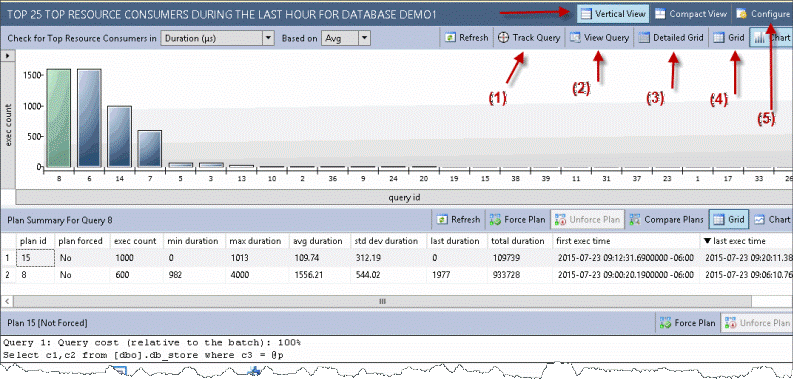
Changing the "Plan Summary" from chart to grid allows us to view statistics for every plan in table format.
The "Track Query" (1) button will open "Tracked Queries" pane. We will review this pane in our next tip.
The "View Query" (2) will open the new SSMS window with T-SQL script of the query:

The "Detailed Grid" button (3) on the left chart will display a list of the top queries with all statistics (more columns displayed):
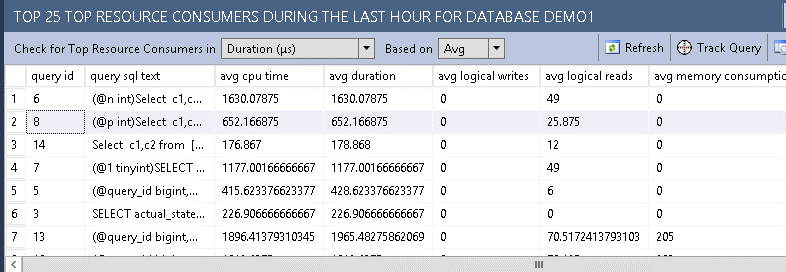
The "Grid" button (4) on the left chart displays list of top queries, but the number of columns will be limited and the columns displayed will depend on the statistic and metric selected:

- Metric
- Statistics
- Time interval
- How many records to return
- Display Time format
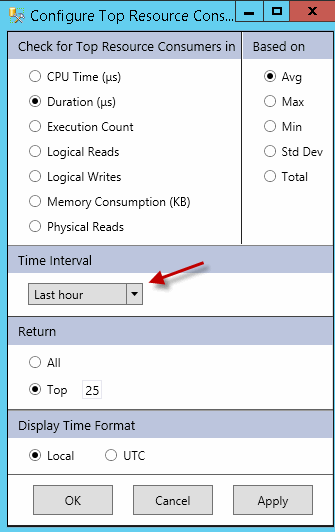
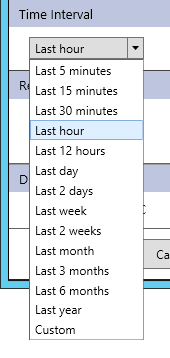
Here are "Time Interval" options:
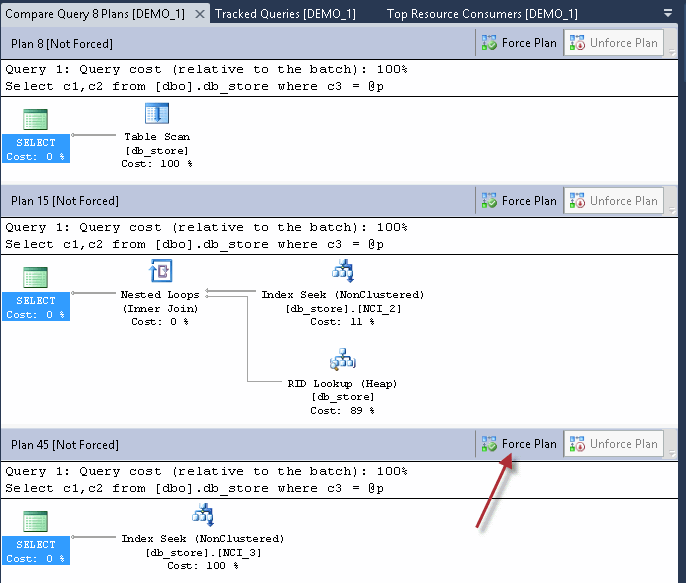
The "Force plan" button is available under the execution plan section and on the left chart.
Statistics Says It All
16
Years of Experience
3000
Gratified Students
100
Training Batches
9600
Training Hours
Subscribe
Please subscribe our technical blog to get recent updates.
 by
by 