SQL Performance Troubleshooting
 by
by Part 1 – Problems and Performance Metrics
Monitoring SQL Server performance is a complex task, as performance depends on many parameters, both hardware and software. It’s recommended to monitor these parameters proactively in order to prevent any potential performance degradation. However, this is not always the case. If the performance degradation happens, the first step towards the resolution is to determine the problem, find out the cause, and resolve the issue. Severe performance issues require quick actions and resolutions. Less severe problems can have a delayed fix. In either case, DBAs should take actions to prevent these situations in future.
It doesn’t mean that every SQL Server slowdown is a performance problem. Some specific actions require many resources and put much stress on the server. If these actions are occasional, they should not be considered as a serious threat and can be ignored. Running your SQL Server under stress all the time should be thoroughly analyzed. It is good to know how the system behaves when there are no performance problems. This can be obtained by collecting baseline information about resource using.
To find out what’s happening with your SQL Server, start with monitoring databases, watch the performance metrics over time to create baselines and trend lines for normal operation, isolate the processes that use a lot of resources. Then you will be able to debug and repair the issues.
Diagnose Problems
To start troubleshooting, you have to define the symptoms first. The most common SQL Server performance symptoms are CPU, memory, network, and I/O bottlenecks, and slow running queries.
CPU bottlenecks are caused by insufficient hardware resources. Troubleshooting starts with identifying the biggest CPU resource users. Occasional peaks in processor usage can be ignored, but if the processor is constantly under pressure, investigation is needed. Adding additional processors or using a more powerful one might not fix the problem, as badly designed processes can always use all CPU time. Query tuning, improving execution plans, and system reconfiguration can help. To avoid bottlenecks, it’s recommended to have a dedicated server that will run only SQL Server, and to remove all other software to another machine.
Memory bottlenecks can result in slow application responsiveness, overall system slowdown, or even application crashing. It’s recommended to identify when the system runs with insufficient memory, what applications use most of memory resources, whether there are bottlenecks for other system resources. Reviewing and tuning queries, memory reconfiguration, and adding more physical memory can help.
Network bottlenecks might not be instantly recognized, as they can at a first glance be considered as SQL Server performance issues caused by other resources. For example, a delay of data sent over a network can look like SQL Server slow response.
I/O bottlenecks are caused by excessive reading and writing of database pages from and onto disk. A bottleneck is manifested through long response times, application slowdowns and tasks time-outs. If other applications use disk resources excessively, SQL Server might not get enough disk resources for its normal operation and would have to wait to be able to read and write to disk.
Slow running queries can be a result of missing indexes, poor execution plans, bad application and schema design, etc.
Common Causes of Performance Issues
The causes for performance problems can be various, but the most common are a poorly designed database, incorrectly configured system, insufficient disk space or other system resources, excessive query compilation and recompilation, bad execution plans due to missing or outdated statistics, and queries or stored procedures that have long execution times due to improper design.
Memory bottlenecks are caused by limitations in available memory and memory pressure caused by SQL Server, system, or other application activity. Poor indexing requires table scans which in case of large tables means that a large number of rows is read from disk and handled in memory.
Network bottlenecks are caused by overload on a server or network, so the data cannot flow as expected.
I/O issues can be caused by slow hardware used, bad storage solution design, and configuration. Besides hardware components, such as disk types, disk array type, and RAID configuration that affect I/O performance, unnecessary requests made by a database also affect I/O traffic. Frequent index scans, inefficient queries, and out of date statistics can also cause I/O workload and bottlenecks.
What Metrics to Monitor
To start troubleshooting the most common CPU performance issues, monitor % Processor Time. This counter is available in Performance Monitor. If its value is constantly higher than 80%, the processor is under pressure.
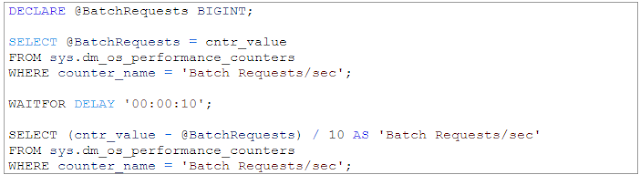
The counters that indicate most common causes for processor pressure are Batch Requests/sec, SQL Compilations/sec, and SQL Recompilations/sec. These counters are available in Performance Monitor and in the sys.dm_os_performance_counters view.
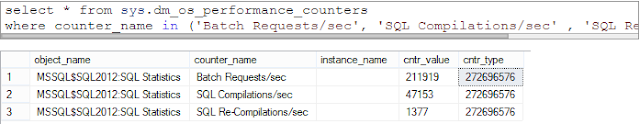
Just note that the counter type for all three counters is 272696576 and that the values shown are cumulative since the last SQL Server start, so they have to be calculated. One of the methods is to take two samples with a 10-second delay.
The Batch Requests/sec value depends on hardware used, but it should be under 1000. The recommended value for SQL Compilations/sec is less than 10% of Batch Requests/sec and for SQL Re-Compilations/sec is less than 10% of SQL Compilations/sec.
For memory problems, monitor the Memory Available KB performance counter. The normal values should be over 200 MB. If the value of Memory Available KB counter is lower than 100 MB for long time, it’s a clear indication of insufficient memory on the server. This counter is available in Performance Monitor, and two more useful counters – Total Server Memory (KB) and Target Server Memory (KB) are available via the sys.dm_os_performance_counters view.
Another counter to monitor is Pages/sec, it is available in Performance Monitor. It shows the rate at which the pages are written from disk to RAM and read from RAM to disk. The values higher than 50 show intensive memory activity and possible overhead and memory pressure that can lead to SQL Server performance degradation.
Checkpoint pages/sec and Lazy writes/sec indicate whether dirty pages are flushed to disk too often. Dirty pages are automatically flushed to disk at a checkpoint. If the available free space in the buffer cache between two checkpoints is low, a lazy write will occur to flush the pages from buffer to disk and free up memory. The Lazy Writes/sec value should be below 20. Both counters are available in Performance Monitor and the sys.dm_os_performance_counters view, but as the counter type is 272696576, the values returned by the view should be calculated.
If the Lazy Writes/sec value is constantly above the threshold, check the Page Life Expectancy value. Values below 300 seconds indicate memory pressure. The counter is available in Performance Monitor and the sys.dm_os_performance_counters view, no additional calculation is needed.
Buffer Cache Hit Ratio shows the ratio of the data pages found and read from the SQL Server buffer cache and all data page requests. If a page doesn’t exist in the buffer cache, it has to be read disk, which downgrades performance. The recommended value is over 90. The counter is available in Performance Monitor and the sys.dm_os_performance_counters view.
As the counter type is 537003264, the value returned by the view has to be calculated to get the current value. To do that, it’s necessary to use the Buffer Cache Hit Ratio Base value also.
Buffer Cache Hit Ratio % = 100 * Buffer Cache Hit Ratio / Buffer Cache Hit Ratio Base
= 100 * 1,797 / 1,975 = 90.98%
Troubleshooting network problems should start with finding queries, functions, and stored procedures that have slow response time. If they are executed quickly, but with a large delay between two calls, it can be an indication of a network issue. SQL Server Profiler can be used to determine which queries, functions and stored procedures were executed.
For I/O problems, monitor disk-related counters: Average Disk Queue Length, Average Disk Sec/Read, Average Disk Sec/Write, %Disk Time, Average Disk Reads/Sec, and Average Disk Writes/Sec. All counters are available in.
Performance Monitor
Average Disk Queue Length shows the average number of I/O operations that are waiting to be written to or read from disk and the number of currently processed reads and writes. The recommended value is below 2 per individual disk, and higher values indicate I/O bottlenecks.
Average Disk Sec/Read shows the average time in seconds needed to read data from disk. The recommended values are given for categories, where under 8ms is excellent performance, and higher than 20ms is a serious I/O issue.
Average Disk Sec/Write shows the average time in seconds needed to write data to disk. The performance is excellent if the value is below 1ms and bad if the counter value is higher than 4ms.
Average Disk Reads/Sec and Average Disk Writes/Sec show the rate of read and write operations on disk, respectively. Low values indicate slow disk I/O processing, and checking processor usage and disk-expensive queries is recommended. The normal values depend on disk specification and server configuration. These counters don’t have a specific threshold, so it’s recommended to monitor these metrics for a while and to determine trends and set a baseline.
SQL Server performance can be affected by many factors. When troubleshooting problems, it’s necessary to know where to start, to know the normal values for the performance counters and to select a tool that will provide sufficient information for analyzing and troubleshooting the issues.
Part 2 - Monitoring Utilities
In this article, presented native Windows and SQL Server tools commonly used for troubleshooting SQL Server performance issues. Selecting the right performance monitoring utility depends on your monitoring goals and coding knowledge, as the tools provide different information and have different analysis capability.
SQL Server Profiler
SQL Server Profiler is a monitoring tool that you can use to create and manage SQL Server traces for monitoring SQL Server instance activity. These trace files can later be analyzed and replayed. Profiler has a graphical interface, which makes it easy to use.
Besides auditing actions that happened on a SQL Server instance, it is useful for SQL Server performance troubleshooting, as it can track stored procedure and query execution and show the slow ones, capture statements and events that caused performance degradation, replay the specific set of events in another environment for testing purposes, etc.
To start SQL Server Profiler:
- Open Start, All Programs (Windows + C for Windows 8)
- Select SQL Server Profiler Or
- Open SQL Server Management Studio
- From the Tools menu, select SQL Server Profiler Or
- Open Command Prompt
- Type profiler
- Press Enter
Now, you should create traces that will collect the information you need in order to monitor and troubleshoot SQL Server performance.
To create a new trace:
- In SQL Server Profiler, open File in the menu
- Select New Trace
- Select a SQL Server instance, Authentication Mode, and provide credentials
- In the Event selection tab, click Show all events
Select the events and event columns you want to trace
To capture information about events that occur on a database, e.g. data and log files auto-grow and auto-shrink events, select these events in Database event type
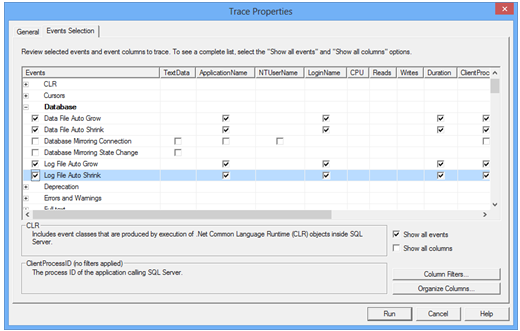
To trace various errors, such as CPU threshold exceeded, select this event in the Errors and Warnings EVENT type.
- In the General tab, select whether to save the trace to a file or to a table
- Click Run
All events that belong to the event types selected for tracing will be captured
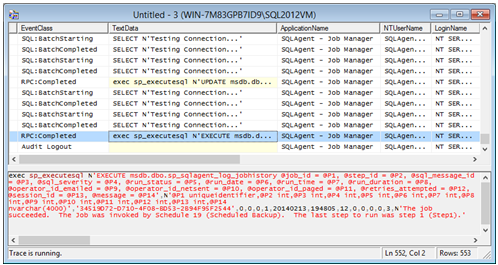
Although SQL Server Profiler provides a lot of useful information, some DBAs avoid using it on a production server, as it can add significant overhead. Also, if you haven’t configured SQL Server trace collection property to collect just the information you really need for analysis, there will be plenty of collected data which might be difficult to analyze.
Windows Performance Monitor
Windows Performance Monitor is a monitoring tool shipped with Windows. It tracks various performance counters and monitors overall system and application performance. The counter values are shown in real-time graphs and can be saved in log files and used for later analysis.
Windows Performance Monitor provides a wide range of counters. Monitoring too many counters will affect system performance and make analysis difficult, so it’s necessary to determine monitoring goals first, and then select the counters to monitor. A well-selected set of counters provides enough information for useful conclusions, quick diagnosis, and finding the problem origin, therefore efficient problem solving. Capturing too little or wrong counters will not provide enough information for useful conclusions, might be misleading and induce wrong conclusions.
When it comes to selecting the counters, it’s necessary to understand what they represent, what are acceptable values, whether there is a threshold, or the value determined based on a trend line.
To open Windows Performance Monitor:
- Open Start, Run (Windows + R for Windows 8), type perfmon, and press Enter
- Open Control Panel, System and Security, Administrative Tools, and click Performance Monitor
To add a counter:
- Select Add Counters in the context menu, or click the Add icon in the menu
- Select the computer you want to monitor
In the list of available counters, select the counter group e.g. MSSQL$2012:Buffer Manager and then Lazy writes/sec
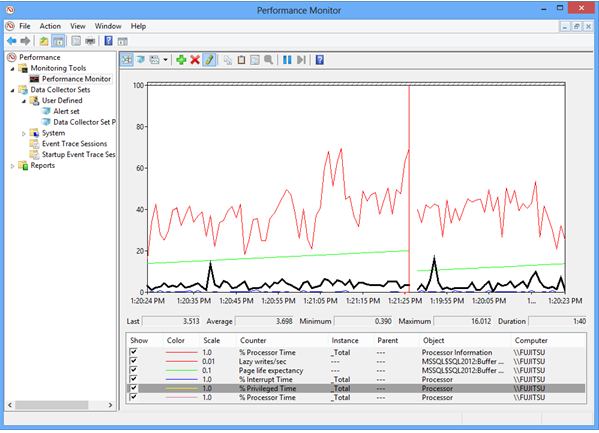
Windows Performance Monitor shows useful information in comprehensive real-time graphs and can save historical data for a long time, so it can be used for later analysis. Its disadvantages are that it cannot provide sufficient information for deep analysis nor show a trend line or a threshold in the graph.
SQL Server Activity Monitor
SQL Server Activity Monitor is a feature available in SQL Server Management Studio, useful for quick and basic SQL Server activity monitoring. It shows only information about the SQL Server processes and their effect on SQL Server performance.
It shows % Processor Time, Waiting Tasks, Database I/O, and Batch Requests/sec in the Overview pane; the list of currently running processes on the SQL database in the Processes pane; the information about waits for resources in the Resource Waits pane; a list of all databases on the SQL Server instance along with information about the database files, their paths, and names in the Data File I/O pane, and the list of the queries recently executed that use most of memory, disk, and network resources in the Recent Expensive Queries pane.
To start Activity Monitor, right-click the SQL Server instance in Object Explorer and select Activity Monitor.
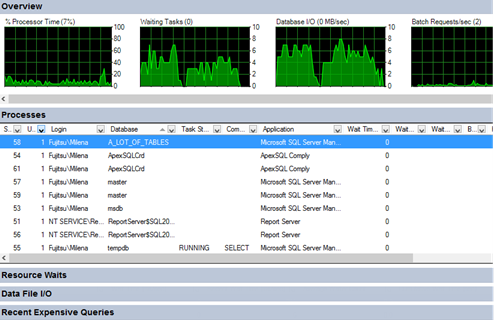
Activity Monitor cannot provide data for deep investigation, store historical records for later analysis, nor can additional parameters be monitored.
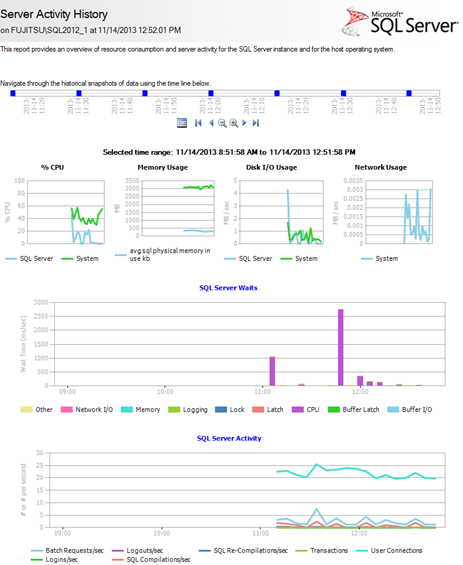
SQL Server Data Collector
To open Data Collection reports
- In SQL Server Management Studio Object Explorer, expand Management
- Right-click Data Collection and select Reports
Select any of the available reports – Server Activity History, Query Statistics History, or Disk Usage Summary
Dynamic Management Views (DMVs)
Besides the monitoring utilities available in Windows and SQL Server Management Studio, Dynamic Management Views (DMVs) can also be used to monitor SQL Server performance and troubleshoot issues. These views are: sys.dm_exec_sessions, sys.dm_os_performance_counters, sys.dm_os_memory_brokers, sys.dm_os_memory_nodes, sys.dm_exec_procedure_stats, sys._dm_os_sys_info, sys.dm_exec_requests, sys.dm_exec_requests, and many more.We’ll present only a few commonly used views for SQL Server performance monitoring in this article.
sys.dm_exec_sessions – returns a row for every session on the queried SQL Server instance, along with details such as the name of the program that initiated the session, session status, SQL Server login, various time counters, and more.
sys.dm_exec_requests – returns a row for every user and system request being executed on the SQL Server instance. To find the blocked requests, search for the requests where the status column value is ‘suspended’.
sys.dm_exec_query_stats – returns a row for every query statement in a cached query plan. It provides information about average, minimal, maximal, and total processor time used by the plan, along with other useful information for performance analysis.
sys.dm_os_performance_counters – returns a row for each SQL Server performance counter. It provides a quick way to find out current performance counter values. However, there are five counter types, and to be sure you’re interpreting the returned values correctly, you have to know how to calculate a value for each counter type. It’s easiest with the counter type 65792, as no calculation is needed. Counter types 1073874176, 537003264, and 272696576 require additional calculation in order to provide the metric current value.If the values are not properly calculated, they can be confusing, misleading, and lead to wrong conclusions.
SQL Server Extended Events
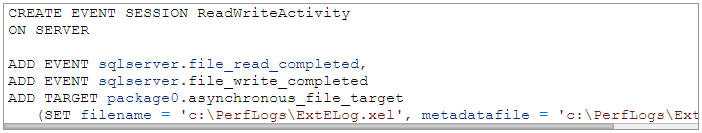
SQL Server Extended Events allow collecting information useful for troubleshooting SQL Server performance issues. They enable finding the most expensive queries, latch, deadlock, and blocking causes, troubleshooting excessive processor usage, and more.To use Extended Events for performance monitoring, determine which events you want to monitor, and create a session using SQL Server Management Studio options, or T-SQL.To create the ReadWriteActivity session to capture event data for completed file reads and writes, and write it from the log cache file to the physical log file:
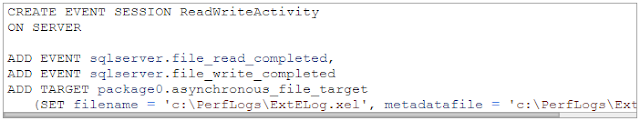
After the session is created, to start it:
- Expand Management in Object Explorer
- Expand Extended Events
- Expand Sessions
- Find the Event Session, right-click it and select Start
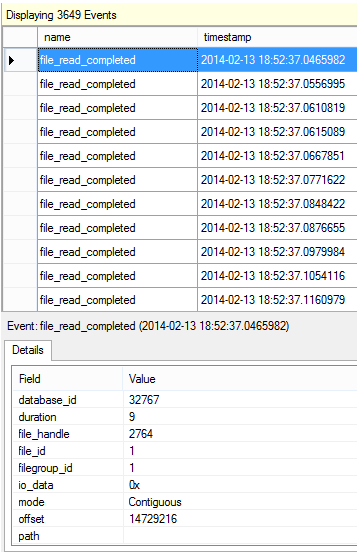
To see the live event data with its details, select Watch Live Data from the event context menu in Object Explorer

There is also the built-in system_health session started automatically at SQL Server service start up, which provides useful information for performance troubleshooting.In this article, we presented the SQL Server performance monitoring utilities available in Windows and SQL Server. The information they provide and knowledge required to use them varies. Some of them, like Activity Monitor, are easy to use and require no coding, but at the same time provide only basic information useful just to get the general picture. On the other hand, Extended Events can monitor and handle various run-time errors, resource bottlenecks, blocking, etc. But to get the most of them, coding is required.
SQL Server Extended Events allow collecting information useful for troubleshooting SQL Server performance issues. They enable finding the most expensive queries, latch, deadlock, and blocking causes, troubleshooting excessive processor usage, and more.To use Extended Events for performance monitoring, determine which events you want to monitor, and create a session using SQL Server Management Studio options, or T-SQL.To create the ReadWriteActivity session to capture event data for completed file reads and writes, and write it from the log cache file to the physical log file:
After the session is created, to start it:
- Expand Management in Object Explorer
- Expand Extended Events
- Expand Sessions
- Find the Event Session, right-click it and select Start
To see the live event data with its details, select Watch Live Data from the event context menu in Object Explorer
There is also the built-in system_health session started automatically at SQL Server service start up, which provides useful information for performance troubleshooting.In this article, we presented the SQL Server performance monitoring utilities available in Windows and SQL Server. The information they provide and knowledge required to use them varies. Some of them, like Activity Monitor, are easy to use and require no coding, but at the same time provide only basic information useful just to get the general picture. On the other hand, Extended Events can monitor and handle various run-time errors, resource bottlenecks, blocking, etc. But to get the most of them, coding is required.
Statistics Says It All
16
Years of Experience
3000
Gratified Students
100
Training Batches
9600
Training Hours
Subscribe
Please subscribe our technical blog to get recent updates.