Interpret Query Execution Plan Operators
 by
by Query Execution Plan and Operators
In the last article we discussed how a query execution plan generates, now we will discuss how to interpret a query execution plan and its operators, which are being used to generate a graphical query execution plan by SQL Server.SQL Server provides a variety of query execution plan formats like a graphical plan, text plan and XML plan. A graphical plan is the most preferred way to understand the query execution by developers and DBAs. The graphical execution plan uses icons to represent the execution of queries in SQL Server; these icons are known as operators. This is very useful for understanding the characteristics of a query.
A plan represents how data flows from a child operator to a parent operator in the form of a tree structure. Query execution flow can be read from right to left and from top to bottom.In this article we’ll discuss some common and important operators like Index seek/scan, Join (Nested, Merge, and Hash), etc., which are useful to interpret a graphical execution plan and troubleshoot any performance issue due to a badly written query.
Query Execution Plan Components
Let’s start with a simple example: We are retrieving all available columns from a table using SSMS and getting the estimated execution plan (Ctrl+L).
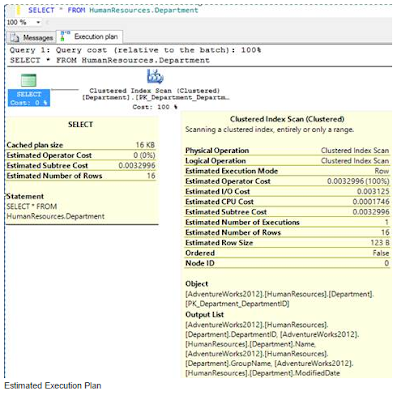
In the execution plan you can observe three things:
- Flow of query execution – left to right.
- Size of arrow between both operators – thickness represents size of the data flowing; thicker mean more data is flowing.
- Tooltip message – if you hover your mouse pointer over any operator, it gives detailed information about the query execution plan operator.
In above image, you can see two operators available, Select and Clustered Index scan; once we hover the mouse pointer over an operator a tool tip displays, which provides detailed statistics generated by optimizer. You can interpret the execution plan in such a way that first the optimizer scans a cluster index then returns the data as output.The tool tip message of the select operator shows the following numbers generated by the optimizer:
- Cached Plan Size – memory used to store generated execution plan.
- Estimated Operator Cost – percentage cost taken by the operator.
- Estimated Subtree Cost – represents the amount of time that the optimizer thinks this operator will take. It’s a cumulative cost associated with the whole subtree up to the node.
- Estimated Number of Rows – number of rows to be returned from operator, in this case the Select operator.
And tool tip messages of a clustered index scan operator shows the following numbers generated by the optimizer:
- Physical Operation – operation to be taken by the engine.
- Logical Operation – a conceptual model of query processing.
- Estimated I/O & CPU Cost - estimated part of the operator’s cost associated with resource I/O and CPU. It can help you to identify whether the query is I/O or CPU intensive.
- Estimated Operator Cost, Estimated Subtree Cost - explained above.
- Estimated Number of Rows –common operation but dealing with a different set of data. It helps to understand query performance as how data rows are added or filtered out by each operator.
- Estimated Row Size –shows the total size of the row, sometimes the actual value differs because the table might have variable length attribute types.
- Ordered –tells whether data on which operator is working is ordered or not.
- Node ID –tells the operator number in order from right to left despite of the fact that query execution happened left to right.
In the bottom part of the tool tip message you can see the Object and Output List, which shows other aspects related to the operator like used object name, output, arguments, etc.The above details are related with the estimated execution plan; there is one more form of graphical query execution plan available, i.e. Actual Execution Plan (Ctrl+M). This is the plan that the engine generates at the time of query execution, whereas query execution is not required to get the Estimated Execution Plan.Below is the tool tip message image of the Clustered Index Scan operator in the Actual Execution Plan:
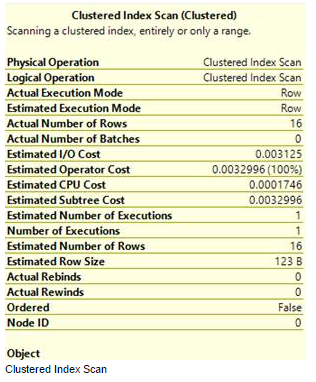
The actual Execution Plan provides additional information, which shows more facts about query execution like Actual Execution Mode, Actual Number or Rows, Actual Number of Batches, Actual Rebinds and Actual Rewinds, etc.All these attributes and its values help us to understand the internal steps taken by SQL Server to execute a query.
Understanding Operators
We have seen a query execution plan is a combination of multiple operators and how an arrow bridges between child operators to parent operator.There are mainly two types of operators; Logical and Physical. Logical operators describe a query processing operation on a conceptual level. Physical operators actually implement the operation defined by a logical operator using identified method or algorithm. For example, "join" is a logical operation, whereas "nested loops joins" or “Hash Join†or “Merge Join†is a physical operator. You can find mapping details between logical and physical operators on MSDN.Let’s discuss some of the common operators:
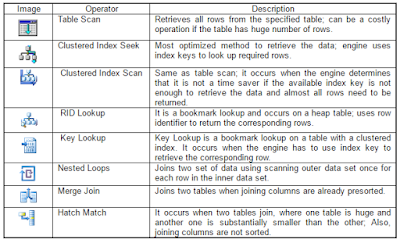
This list of operators represents a selected set of operators; you can get a complete list on MSDN.
Summary
Graphical execution plan is the great way to learn the end to end execution of a query. You can easily interpret the meaning of the icon/operator with the detail provided by SQL Server engine and can take appropriate action if find any significant issue. This iconic representation of an execution plan not only gives you an understanding of the query execution flow but adds flexibility to compare the cost of multiple queries.
Statistics Says It All
16
Years of Experience
3000
Gratified Students
100
Training Batches
9600
Training Hours
Subscribe
Please subscribe our technical blog to get recent updates.