SQL Server BI (SSIS, SSRS, SSAS & Power BI) Training (Online)
By Sruthi, SQL Server BI Architect!!! (*****)
Course Description
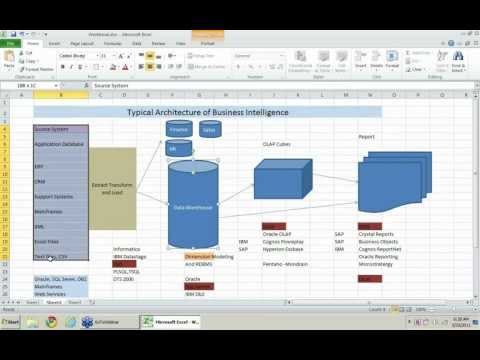
Our Microsoft Business Intelligence (MSBI) training enables you to master MSBI tools like SSIS, SSRS, SSAS, and Power BI using SQL Server. As part of this training, you will learn data integration and creating reports, dashboards, and cubes for faster reports generation.
SSIS: In the SSIS part of the training, you gain the skills to improve business intelligence capabilities by automating complex migration tasks and auditing the success or failure of migration processes. You will learn to transform data among heterogeneous data sources — such as text files, Oracle, Access, XML, ODBC and OLE DB — and effectively and securely managing data migration across various platforms.
SSRS: In the SSSR part of the training, you learn how to implement a SQL Server Reporting Services solution for data analysis in an organization. The course discusses how to use the Reporting Services development tools to create and manage reports and implement self-service BI solutions.
SSAS: In the SSAS part of the training, you learn how to implement both multidimensional and tabular data models and how to create cubes, dimensions, measures, and measure groups.
Power BI: In the Power BI part of the training, you access data from a wide range of data sources and create Reports using the in-built visuals. You will also learn to format those visuals for maximum effect and import custom M visuals to extend your reporting capability. You will gain expertise in DAX languages and then publish your masterpiece to a workspace in the Power BI Service, creating Dashboards, sharing Reports and Dashboards with colleagues, concluding with scheduling a data refresh.
For course details and registration, please get in touch with Daniel at +1 267 718 1533 (Mobile & Whatsapp). We are based in Philadelphia, USA, and host affordable and comprehensive SQL Server/Azure/AWS/DevOps training programs for students around the globe.
Student Demographic
Course Introduction Video
Course Information
Sruthi's Profile
Sruthi is a highly qualified consultant offering close to 16 years of rich & qualitative experience executing full-cycle Data Warehouse (DWH) & Business Intelligence Projects for companies within several industries. As a Senior Consultant, Sruthi is responsible for end-to-end MSBI solution architecture, delivery oversight, and quality assurance across client verticals. With close to 16 years of experience as a technical architect, she offers competencies across all functional data management components, including ETL processing, data persistence, data visualization, and information distribution. Sruthi has worked with some of the major Telecom, Manufacturing, and IT firms. Sruthi has worked with critical business units in areas such as quality, supply chain, reliability, finance, HR, and engineering. Aside from conducting activities as a technical architect, she has spent much of her career establishing and facilitating custom developer training programs and mentoring less experienced team members and consultants.
Talk to Sruthi
Live Training Videos
We believe in letting our prospective students to watch recorded videos of our live training classes and decide for themselves. If you would still like to attend a one-on-one live demo session, please give call Daniel @ 267 718 1533 and he can schedule one for you at your convenience.
Course Content
Part 1: Power BI - Data Visualization, Dashboard, and KPIs
Module 1: Introduction to Power BI
- Introduction to business intelligence (BI)
- Stages of business intelligence (BI)
- Use cases of BI
- Various BI tools
- Overview of data warehouse and concepts
- Introduction to Power BI
- Why Power BI?
- Power BI components
- Power BI pricing structure
- Building Blocks of Power BI
- Architecture of Power BI
- Power BI vs. Tableau vs. QlikView
- Introduction to Power BI Desktop
- Installation of Power BI Desktop
- The key features of Power BI workflow
- Process of creating reports in Power BI
Module 2: Data Extraction
- Overview of Power BI Desktop
- Data sources in Power BI
- Using files (excel, pdf, csv, etc.) as a data source
- Using SaaS connectors
- Extracting data from folders and databases
- Working with Azure SQL database and database sources
- Connecting to Analysis Services
- Other data sources (OData, web, SharePoint, etc.)
- Python R script in Power BI
- Introduction of power query editor
- Advance editor
- Query dependency editor
Module 3: Data Transformation – Shaping and Combining Data
- Shaping data using Power Query Editor
- Formatting data
- Transformation of data
- Understanding of Data types
- Data profiling for data quality check
- Naming conventions and best practices to consider
- Identify and create appropriate keys for joins
- Working with Parameters
- Merge Query
- Append Query
- Group by of data (aggregation of data)
- Applied steps (query settings)
- Duplicate and reference tables
- Transpose of data
- Fill
- Pivot & Un-pivot of data
- Custom columns
- Conditional columns
- Replace data from the tables
- Split columns values
- Move columns and sorting of data
- Detect data type, count rows, and reverse rows
- Promote rows as column headers
- Hierarchies in Power BI
- M query
Module 4: Data Modelling and DAX
- Introduction to relationships
- Creating relationships
- Cardinality
- Cross-filter direction
- Use of inactive relationships
- Introduction of DAX
- Why is DAX used?
- DAX syntax
- DAX functions
- Context in DAX
- Calculated columns using DAX
- Measures using DAX
- Calculated tables using DAX
- Learning about tables, information, logic, text, iterator
- Time intelligence functions (YTD, QTD, MTD)
- Cumulative values, calculated tables, and ranking and rank over groups
- Date and time functions
- Identify poorly performing measures, relationships, and visuals
- DAX advanced features
Module 5: Data Visualization with Analytics
- Deep dive into Power BI data visualization
- Understanding Power View and Power Map
- Data visualization techniques
- Page layout and formatting
- Power BI Desktop visualization
- Formatting and customizing visuals
- Visualization interaction
- Custom visualization in Power BI
- Top-down and bottom-up analytics
- Drill down
- Drill through
- Page navigations
- Bookmarks
- Selection pane to show/hide visuals
- Comparing volume and value-based analytics
- Combinations charts (dual axis charts)
- Filter pane
- Slicers
- Use of Hierarchies in drill-down analysis
- Theme for corporate standards
- Power BI template for design reusability
- Mastering the best practices
- Performance analyzer in Power BI for monitoring the performance of the report
- Power BI Q&A (Natural Language Query visual)
- Sync slicers
- Tooltips and custom tooltips
- Tables and matrix
- Conditional formatting on visuals
- Waterfall chart, KPI, Donut chart, Scatter chart
- Geographical data visualization using Maps
Module 6: Power BI Service (Cloud), Q & A, and Data Insights
- Introduction to Power BI service
- Introduction of workspaces
- Dashboard
- Creating and configuring dashboards
- Dashboard theme
- Reports vs Dashboards
- Building workspace apps
- Sharing reports and dashboards
- configure subscriptions and data alerts
- Paginated report
- Introduction to Power Q & A
- Ask questions about your data using natural query language
- Getting answers in the form of charts, graphs, and data discovery methodologies
- Configure custom questions for Q&A like FAQ
- Ad-hoc analytics building
- Power Q&A best practices
- Quick Insights
- Subscribe, alerts, usage statics, related content
- Design reports on the Power BI service
- Collaboration using Power BI service
- Row-level security (RLS)
- Introduction of paginated reports
- Introduction of Power BI report server
Module 7: Power BI Settings, Administration, and Direct Connectivity
- Understanding Power BI desktop settings
- Aggregating data from multiple data sources
- Power BI service settings
- Power BI admin portal
- Administration activities
- Power BI usage analysis
- Introduction of Office 365 admin activities
- Introduction of Data Gateway
- Installation and configuration of data gateways
- Scheduling auto data refresh
- Managing groups, row-level security, datasets, reports, and dashboards
- Real-time data analysis using direct connectivity
- Direct query vs import mode
Module 8: Embedded Power BI with API and Power BI Mobile
- Introduction to embedded Power BI
- Create embedded code
- Manage embedded code
- Integration of Power BI in SharePoint
- Introduction of Power BI API
- Power BI embedded playground
- Introduction to Power BI Mobile
- Creating mobile-based reports and dashboards
- Optimizing report for Power BI mobile app
- Features of Power BI mobile app
- Introduction of integrating Power BI & Excel
- Power BI Analyze in Excel
Module 9: Power BI Advance and Power BI Premium
- Advance Power BI and Power BI Premium.
Part 2: SQL Server 2022 Reporting Service (SSRS)
Module 1: Introduction To SSRS & Usage
- SSRS Architecture and Tools
- Three-Phase Report Life Cycle
- Reporting Services Configurations
- Report Server Database and TempDB
- SSRS 2012 and Web Service URLs
- SSRS 2014 and Web Service URLs
- Communication Ports & Encryptions
- Execution Accounts and Usage
- Report Designer Usage and Scope
- Report Builder Usage and Scope
- Report Manager and Options
- RSCONFIG Tool and Limitations
Module 2: Report Planning and Design
- SSRS Report Authoring Options
- Data Sources (RDS) Connections
- Credentials and Security Options
- Toolbox Items and Dataset Options
- Table Reports and Matrix Reports
- Report Images, Textbox and Globals
- Dynamic Expressions and Options
- Reporting Functions and Formatting
- Report Headers and Report Footers
- Enterprise and Ad-hoc Reports
Module 3: Report DataSets and Joins
- Working with Multiple DataSets
- Joining Local and Shared Datasets
- Configuring Dynamic DataSets
- Working with Remote Datasets
- Reusing XML and Shared Datasets
- Dataset Import Options in RDL
- LOOKUP Functions – Limitations
- Sub-Reports and Report Actions
- Joining Rectangle & List Reports
Module 4: Report Design and SubReports
- Designing Wizard-based Reports
- Custom Reports and Report Groups
- Row Drilldown and Column Grouping
- Advanced and Static Options in SSRS
- Chart Reports and Images
- Using SSRS Expressions & Globals
- Accessing and Controlling Reports
Module 5: Report Parameters & Usage
- Report Parameters & Properties
- Dynamic Report Parameters and Filters
- Dependent Parameters & Usage
- Multi-Valued Nullable Parameters
- Report Filters – Options and Types
- Toolbox Filters and Limitations
- Sub-Reports and Report Actions
- Parent-Child Report Parameters
Module 6: Enterprise Reports In SSRS
- Gauge Reports, Indicator Reports
- Pie Charts, Bars and Spark Lines
- Report Testing and Auto Refresh
- Map Reports and Report Dashboards
- Multiple Chart Areas in Dashboards
- Report Dashboard & Limitations
- Report Scorecards with SQL Queries
- Exporting RDL Reports in SSRS
Module 7: Map Reports and Cube Reports
- Map Reports and Stored Procedures
- Indicators with Map Reports
- Designing Reports using OLAP DBs
- Identifying KPIs and Measures
- MDX Queries with Cube Reports
- MDX Filters with Sub-Reports
- Scorecards with MDX and DAX
- Sub-Reports versus Report Actions
- Accessing and Controlling Reports
Module 8: Report Builder & Power View
- Designing DataSets in Report Builder
- Chart and Map Wizard in Report Builder
- Report Parts and Web Services
- Report Designer Vs Report Builder
- Publishing Report Parts with RB
- Stored Procedures with Report Builder
- Report Downloads and Edit Options
- Power Pivot & PowerView Addins
- Power View for RDLX Reports
- Understanding Data Models
- Tables, Charts and Data Bars
- SparkLines and Data-Mashup
- Report Builder Vs PowerView
Module 9: Report Management Options
- Report Manager Configurations
- SSRS Report Builds and Deployment
- Managing Data Source Security
- Exporting and Importing Reports
- Snapshot Management & Schedules
- ReportServer Tempdb Usage & Tuning
- Linked Reports & Null Parameters
- Report Caching and Memory Refresh
- Managing Reporting Engine & Tuning
- Report Execution Audits & Events
- Tuning SSRS Reports & Memory Options
Module 10: Power View With SSRS
- Managing RDL and RDLX Reports
- Comparing PowerView and Report Builder
- Drillthrough Report Management Options
Part 3: SQL Server 2022 Integration Service (SSIS)
Module 1: Dimension Modeling and Data Warehousing
- Dimension Modeling & Data Ware Housing
- Basic concepts of Business Intelligence
- Basic concepts of Data Warehousing
- Designing facts and dimensions
- Employing key performance indicators
- Dimensional modeling process to design Data Warehouse
Module 2: Introduction to SSIS
- SSIS Basics
- SSDT Introduction
- Connection Managers
- Basic SSIS Package
Module 3: SSIS Control Flow
- Control Flow Basics
- Tasks
- Precedence Constraint
- Containers
Module 4: SSIS Containers
- Four types of container
- Basic FOR loops
- Foreach loops
- Looping over files
- Looping over records
- Other for each loop
Module 5: SSIS Data Flow – I
- Data Flow Basics
- Data Sources - I
Module 6: SSIS Data Flow – II
- Excel, Raw File
- Data Destinations
- OLEDB, Excel, Flat File
- Data Flow – II
- Data Flow Transformation – Introduction
- Row Transformation
- Character Map, Copy Column
- Aggregate, Sort
- Split and Join Transformations
- Conditional Split, Multicast, Union All, Merge Join
Module 7: Data viewers
- Attaching data viewers
- Using dead-end destinations
Module 8: SSIS Package Maintenance
- Handling errors and managing exception rows
- SSIS Package Performance Tuning & Best Practices
- Deploy packages to an SSIS server
- Administering the storage, security, and execution of packages
Part 4: SQL Server 2022 Analysis Service (SSAS)
Module 1: What Is Microsoft Business Intelligence?
- Define Business Intelligence
- Understand the Cube Structure
- Deploy and View a Sample Cube
- View a Cube by using Excel
- View a Cube by using SQL Reporting Services
Module 2: OLAP Modeling
- Understand Basic OLAP Modeling (star schema)
- Understand Dimensional Modeling (stars and snowflakes)
- Understand Measure (fact) and Cube Modeling
Module 3: Introduction to SQL Server Data Tools (SSDT)
- Create Data Sources
- Create Data Source Views
- Create Cubes by using the Cube Wizard
- Understand the Development Environment
Module 4: Intermediate SSAS
- Learn how to Create Key Performance Indicators (KPIs)
- Discover how to Create Perspectives
- See how to Create Translations for Cubes and Dimensions
- Review the three SSAS Action Object Types: Regular, Drillthrough, and Reporting
Module 5: Advanced SSAS
- Work with Multiple Fact Tables and the Dimension Usage Subtab in BIDS
- Explore Advanced Dimension Types
- Learn how to use the Business Intelligence Wizard
- Understand Writeback in Dimensions
- Review Semi-Additive Measures in OLAP Cubes
Module 6: Cube Storage and Aggregation
- View Aggregation Designs
- Customize Aggregation Designs
- Implement Proactive Caching
- Use Relational and SSAS Partitions
- Customize Cube and Dimension Processing
Module 7: Introduction to MDX Queries
- Understand Basic MDX Syntax
- Use the MDX Query Editor in SSMS
- Understand Common MDX Functions and Tasks
- Review MDX Functions New to SSAS 2012
Module 8: MDX Expressions
- Understand the Calculation Subtab
- Learn how to add Calculated Members
- Explore how to add MDX Script Commands
- Discover how to add .NET Assemblies
Module 9: Introduction to Data Mining
- Understand Data Mining Concepts
- Review the Algorithms that SSAS Includes
- Consider Data Mining Clients
- Understand Mining Structure Processing
Module 10: SSAS Administration
- Implement SSAS Security
- Implement XMLA Scripts in SSMS
- Deploy and Synchronize Databases
- Understand SSAS Database Backup and Restore
Module 11: Advanced Administration and Optimization
- Implement SSIS to Manage SSAS Databases
- Explore Clustering
- Explore Scalability Options
- Understand Performance Tuning and Optimization
Module 12: Introduction to SSAS Clients
- Design Reports using Reporting Services
- Design Reports by using Report Builder
- Implement Excel Pivot Tables and Charts
- Use Excel as a Data Mining Client
- Review Microsoft Office SharePoint Server
Course Statistics
16
Years of Experience
3671
Gratified Students
112
Training Batches
9634
Training Hours
Gratified Student Feedback - From Year 2000
-
Akshay is very professional guy with good subject knowledge. Clears the doubts raised by students immediately and also responds promptly to the emails. Thank you.
Course: SQL Server BI
Trainer: akshay jain
kranthi vanga
White Plains, United States -
The trainer is having good knowledge on subject
Course: SQL Server BI
Trainer: Akshay Jain
Swetha Mainampati
Edison, United States -
Trainer was good and gave indepth training on subject matter.
Course: SQL Server BI
Trainer: Akshay
Eric Quarm
Baxter Springs, United States -
Akshay, is an excellent professional trainer with lot of practical skill set. He has good experience with MSBI Architecture, designing, developing and troubleshooting MSBI related features. I was looking for someone time for a trainer who can teach at this pace in theoretically and practically and finally found a trainer like Akshey at this institute. Daniel, I am glad that you have such a nice trainer and I am happy for getting trained under Akshay. Thanks a lot. Regards, Venkat Pasnur
Course: SQL Server BI
Trainer: AKSHAY JAIN
VENKAT PASNUR
Bradenton, United States -
After I took 70 hrs. BI class, I changed my major from MS SQL DBA to BI. I was so attracted to this field and very excited about major change. Each of the lectures was an effective mixture of information, demonstrations, real-life situations, and video clips presented in a manner that enabled us to get more knowledge and understanding. I really appreciate Akhsey’s training skills and look forward to many more classes with Empire Data Systems.
Course: SQL Server BI
Trainer: Akshay Jain
Zelalem
Naval Anacost Annex, United States -
Good course. Excellent trainer.
Course: SQL Server BI
Trainer: akshay jain
vivek chandra
Colorado Springs, United States -
Akshay is a good teacher.He is having good knowledge of MSBI. I will recommend him for others students.
Course: SQL Server BI
Trainer: Akshay Jain
Mukta Tandon
Brampton, Canada -
I have obtained a great knowledge on BI, SSIS, SSAS and SSRS concepts. The demos are very helpful to understand the concept and follow with the training while on session or off line working by my own. Akshay was helpful on explaining issues that are not clear.
Course: SQL Server BI
Trainer: Akshay
Gigi
San Antonio, United States -
Excellent
Course: SQL Server BI
Trainer: Akshay Jain
Madhavi
Ashburn, United States -
I would like to appreciate Akshay for giving us a solid training on SQL Server 2014 BI.
Course: SQL Server BI
Trainer: AKSHAYE
YARED TOLOSSA
Everett, United States -
Akshay is a great trainer. Very professional, patient and friendly individuals and would highly recommend to others for future training courses.
Course: SQL Server BI
Trainer: Akshay Jain
Sandeep Singh Sandhu
Flushing, United States -
Training was good.Thank you Akshay
Course: SQL Server BI
Trainer: AKSHAY
SRIDEVI
Olathe, United States -
The training session was good and was able to understand the course well.
Course: SQL Server BI
Trainer: Akshay Jain
Lakshmi Sravanthi Mantha
Dallas, United States -
The best BI training I have ever had. Thanks Daniel & Akshay
Course: SQL Server BI
Trainer: Akshay Jain
Edward
Jamesburg, United States -
It's a good course and I have learned a lot.
Course: SQL Server BI
Trainer: Akshey Jain
Jane Williams
East Moline, United States -
Very helpful training. Easy to understand and detailed explanation on each and every topic using simple examples. Thank you Akshay and very good job. Keep it up.
Course: SQL Server BI
Trainer: Akshay Jain
Renjini Baby Girija
Roswell, United States -
Training was awesome,affordable and very detailed.Trainer Akshay was so knowledgeable and so polite. I recommend this course and specially trainer very strongly.
Course: SQL Server BI
Trainer: Akshay
Syed Farrukh Asghar
Tampa, United States -
Parth was one of, if not the best instructor. He gave us a lot of helpful hints, excellent scripts, and great tips. It was a pleasure taking this class! His interest and enthusiasm for Oracle was very evident. I am hoping to take the next DBA class in the near future.Excellent job!! Thank you very much
Course: SQL Server BI
Trainer: Parth
Geofrey
Columbia, United States -
He did good job.
Course: SQL Server BI
Trainer: Honey Goyal
Sunil Shah
Cherry Hill, United States -
Great instructor. Honey demonstrated in-depth knowledge of the subject matter and was readily available to help out with any problems.
Course: SQL Server BI
Trainer: Honey Goyal
Richmond
Minneapolis, United States -
Great Trainer, Explaining Complicated Theory in simple terms and understandable.
Course: SQL Server BI
Trainer: Honey
Arun
Minneapolis, United States -
BI training is worth. Honey Goyal is a Good Instructor. Very systematic approach
Course: SQL Server BI
Trainer: Honey Goyal
SUMANTH KATTA
Frankfort, United States -
Positive and good in delivering the subject.
Course: SQL Server BI
Trainer: Honey Goyal
Swetha Muduhudla
Saline, United States -
He explain very nicely
Course: SQL Server BI
Trainer: Honey goyal
Amruta
Shrewsbury, United States -
Hi, Very good online training. I will recommend it to anyone interested in SQL Server BI development, implementation and maintenance.
Course: SQL Server BI
Trainer: Honey Goyal
Kouassi Koffi Bernabe
Montreal, Canada